
Key Insights
- Broad M&A multiples rarely reflect individual community bank valuations, where specific circumstances dictate transaction pricing.
- Acquirers nearing the $10B Durbin threshold must account for interchange revenue impacts, directly affecting purchase offers.
- Dilution tolerance, earnback timelines, and loan marks shape what acquirers will pay more than national averages.
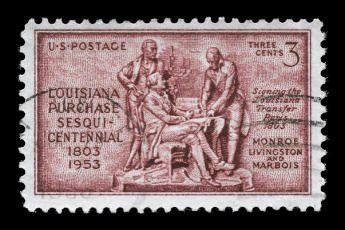
In early 1803, President Thomas Jefferson sent James Monroe to Paris with authority to spend up to $10MM for New Orleans and West Florida. Napoleon, having abandoned his plans for a French empire in North America, instead offered the entire Louisiana Territory for $15MM. The two envoys reached an accord, even though the deal far exceeded their instructions.
The sizeable purchase covered around 530MM acres, or less than three cents per acre. No appraisal of land values produced that number. One seller's circumstances at one moment led to a historically good land deal for the fledgling United States.
Bank pricing works much the same way today. Market averages describe the broad environment, but a signed merger agreement reflects one buyer, one seller, and one price.
What the Headline Averages Measures
Forvis Mazars reports that the average price for whole bank and thrift transactions through June 2026 was 150% of tangible book value, up from 146% a year earlier and 144% for all of 2025. This price-to-tangible-book-value ratio compares a transaction’s purchase price with the target’s equity excluding goodwill and other intangible assets. A multiple of 150%, or 1.50x, means a buyer is paying $1.50 for each $1 of tangible book value.
For boards of community financial institutions (CFIs), that average provides useful context for strategic discussions. But it summarizes transactions with available pricing data; it is not an appraisal of every institution considering a sale. This fall’s announcements illustrate four reasons boards need to look beyond the headline figure.
1: Individual Deals Can Differ Substantially From the Average
Several recently announced acquisitions involved targets in the $1B–2B asset range, yet their disclosed pricing multiples varied considerably:
- Equity Bancshares agreed to pay $123.8MM in cash and stock for $1.7B-asset Lincoln Bancorp at approximately 105% of tangible book value.
- John Marshall Bancorp agreed to pay $253MM in stock for $1.8B-asset Eagle Financial Services at 130% of tangible book value.
- Third Coast Bancshares announced a $239.6MM all-stock deal for $1.9B-asset Great Plains Bancshares at 156% of tangible book value.
- Byline Bancorp agreed to pay $87.9MM in cash and stock for $617.3MM-asset Illinois State Bancorp at 107% of tangible book value.
2: Geography and Disclosure Shape the Benchmark
The national figure also conceals substantial regional differences. In the same Forvis Mazars report, first-half regional averages ranged from 122% of tangible book value in the Mid-Atlantic to 179% in the Southeast. Those figures rested on just three transactions with available pricing data in each region. The Midwest’s 150% average drew on 11 priced transactions out of 44 announced deals.
Disclosure gaps remain visible in more recent announcements. Three of the seven acquisitions in ABA Banking Journal’s October 7 and October 13 roundups disclosed no purchase price. Those transactions offer evidence of deal activity, but not a publicly usable pricing multiple.
The distinction matters: a headline average describes the transactions that can be measured, not every transaction taking place. Boards should therefore examine the geography, number of observations, and comparability of the underlying deals before treating an average as a valuation guide.
3: A Buyer’s Growth Path Changes Its Economics
Buyer-specific factors can move a price as much as anything on the seller's balance sheet. Equity's purchase of Lincoln would bring its pro forma assets to about $9.1B, within reach of the $10B threshold at which the Durbin Amendment's debit interchange cap applies. Equity CFO Chris Navratil estimated the interchange-related impact of crossing the threshold could run $7–13MM. Offsetting it would take another $400–900MM, depending on profitability assumptions.
Those estimates do not establish how much the threshold affected Lincoln’s negotiated price, and the acquisition itself would leave Equity below $10B. They do illustrate a consideration that a national pricing average cannot capture: where a particular acquisition places the buyer on its growth path.
A board applying the national multiple to its own tangible book value would miss that buyer-specific calculation. Evaluating a potential offer requires understanding not only the seller’s franchise, but also the financial consequences for the institution making the offer.
4: Purchase Accounting and Return Targets Sit Behind the Multiple
Public acquirers also disclose figures that seldom surface in a seller's pricing conversation. Equity's investor presentation estimated 3.8% tangible book value dilution at closing, with an earnback period of about 2.6 years. Its due diligence modeled an $18MM gross credit mark on Lincoln's loans (1.5%) and a $27.8MM loan interest rate mark (2.3%). Those marks come off before a buyer arrives at a price it can defend to its shareholders.
That is a direct connection between transaction-specific analysis and price. The headline multiple does not reveal the full set of credit assumptions, valuation adjustments, anticipated savings, and capital effects supporting an offer. Two deals with different multiples may therefore reflect different underlying economics rather than a straightforward difference in franchise quality.
Use Averages as a Starting Point
For CFI boards, the practical question is not simply, “What is the market average?” It is, “Which transactions are comparable to our institution, and what would a potential buyer’s financial model support?”
That means examining relevant deal multiples alongside the target’s markets, balance sheet, and earnings prospects, then considering the acquirer’s growth plans, purchase-accounting assumptions, and expected returns. Like the per-acre figure associated with the Louisiana Purchase, a transaction multiple summarizes the outcome; it does not explain everything that produced it. Boards that make that distinction can approach strategic discussions with a clearer view of value—whether exploring a sale, pursuing acquisitions, or remaining independent.