
Did you know that canaries were used well into the 20th century to alert coal miners to the presence of poisonous gases in the mine? This practice gave rise to the familiar expression, “canary in a coal mine”. In nature, many organisms — such as certain amphibians, birds, fish, and bees — serve as sentinels, detecting environmental changes and signaling potential threats. In the banking world, the role of sentinel is filled by financial metrics, which regulators monitor closely to track the health and stability of the sector.In its Q3 report, the Federal Deposit Insurance Corporation (FDIC) paints a positive picture of the banking industry as a whole, and community banks in particular. Overall, these institutions remain financially robust, with expanding balance sheets and sound asset quality, demonstrating resilience even amid challenging economic conditions. Here are some key takeaways from the FDIC’s Q3 report.1. Financial performance is strong.
- Net income rose to $8.4B, up $756.9MM (9.9%) over the previous quarter and 27.1% YoY.
- Pretax return on assets (ROA) increased 13bp from Q2 and 25bp YoY, reaching 1.46 %.
- A quarterly increase in net interest income ($958.5MM, or 4.1%) along with a rise in noninterest income ($371.1MM, or 7.1%) more than compensated for the growth in noninterest expenses ($303MM, or 1.7%).
- Net interest margin (NIM) increased to 3.73%, up 10bp from Q2 and 37bp YoY.
- The percentage of community banks posting a quarterly loss dropped to 5.1%, compared with 5.6% in the previous quarter.
- Net operating revenue (net interest income plus noninterest income) increased to $29.7B, a rise of 4.7% over Q2 and 14.8% YoY.
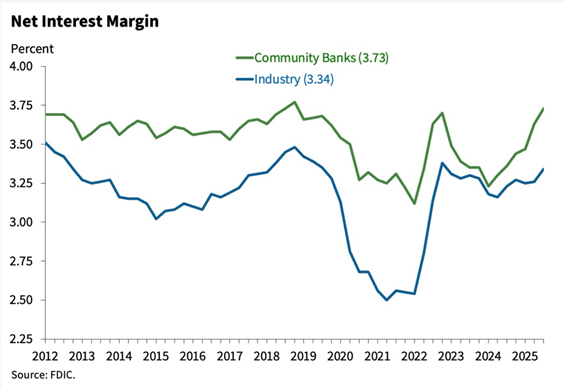
Source: FDIC Q3 Community Bank Charts and DataCommunity banks delivered a notably strong performance in Q3, with widespread earnings growth, revenue expansion, and improved operating efficiency, as well as broad-based profitability gains.2. Asset quality remains good overall.
- The ratio of past-due and nonaccrual (PDNA) loans at community banks was 1.26%, down 1bp from Q2 and 24bp below the pre-pandemic average of 1.50%.
- The net charge-off (NCO) ratio was 0.23%, up 4bp from the previous quarter and 7bp from a year ago. The ratio remains above the pre-pandemic average of 0.15%. At 0.16%, commercial real estate (CRE) charge-offs continue to make up a large proportion of the rise.
- The reserve coverage ratio (the allowance for credit losses relative to noncurrent loans) fell by 6.4% from the previous quarter and 28.2% YoY, reaching 157.1%.
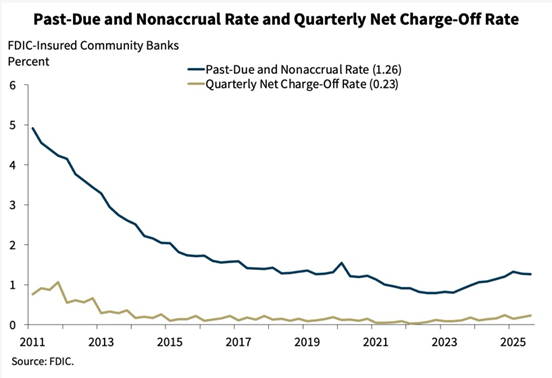
Source: FDIC Q3 Community Bank Charts and DataOverall, asset quality remains favorable for community banks, with the ratio of PDNA loans slightly better than in Q2, indicating that most borrowers are still meeting payment obligations. However, there are some early signs of softening with the rising NCO, particularly in CRE, indicating a deterioration in credit performance in one of the most important and potentially volatile sectors for community banks. While above pre-pandemic averages, the declining reserve coverage ratio could suggest increased vulnerability if loan defaults rise.3. Loan and deposit growth is healthy.
- Total assets reached $2.8T, up 1.6% from Q2 and up 4.1% YoY.
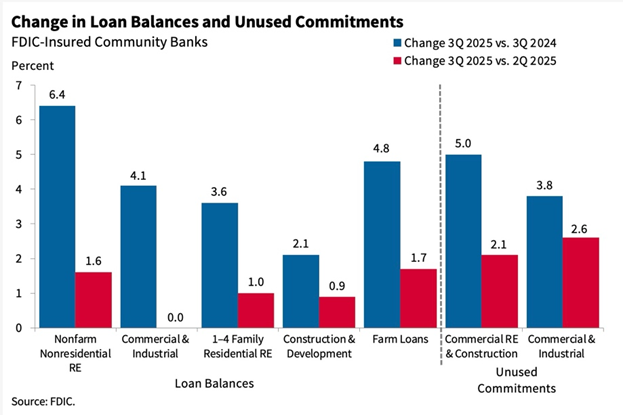
- Loans and leases increased 1.3% over the quarter, and 5.2% YoY to $1.9T. Loan growth was widespread across most major portfolios, with the exception of auto and credit card loans. Nonfarm nonresidential CRE loans had the highest growth, at 6.4%.
- Domestic deposits grew by 1.6% QoQ and 5.1% YoY, reaching around $2.3T. Both uninsured and insured domestic deposits grew — by 3.2% and 0.8%, respectively.
Source: FDIC Q3 Community Bank Charts and DataThe sector’s balance sheets are expanding overall, supported by steady deposit inflows and broad-based lending growth. However, a higher share of uninsured deposits suggests potential liquidity sensitivity if depositor confidence changes — an area institutions should continue to monitor carefully.4. Capital levels are robust.
- Tier 1 risk-based capital ratio (for those community banks not using the CBLR framework) was 14.27%, up 14bp from Q2. Average community bank leverage ratio for those using CBLR was 12.44%, up 3bp. The overall leverage was 11.08%, up 6bp from Q2.
- There were no community bank failures in Q3 2025. The number of community banks declined slightly to 3,953, down 26 from Q2.
Strong capital positions among community banks and the wider industry support lending and provide a buffer against potential losses across the sector.Overall, Q3 2025 was a strong quarter for community banks: higher profitability, expanding margins, deposit and loan growth, good capital, and stable asset quality. The FDIC’s Q3 report demonstrates that community banks are in a healthy position, successfully balancing growth, profitability, and stability as they navigate the evolving economic landscape.